Bateson demonstrated that Japanese quails were attracted to moderately close kin, which is a strategy which would confer a fertility advantage and can be compared with mating strategies in other species.
It is abundantly clear from the evidence that outbreeding depression will lead to extinction. As the renowned Professor Robin Fox said in a chapter title, “Marry in or Die Out.” 18
Patrick Bateson placed Japanese quail in cages where they could approach quail of the opposite sex visible through each window. The test bird, of either sex, and the choices were visible to each other, but different choices could not see each other. Bateson saw how much time a bird would spend near siblings from the same clutch of eggs brought up together, siblings that had been brought up apart, cousins of different degree out to “unrelated,” which of course means very distantly related, birds. Here in figure 44 is what he found:
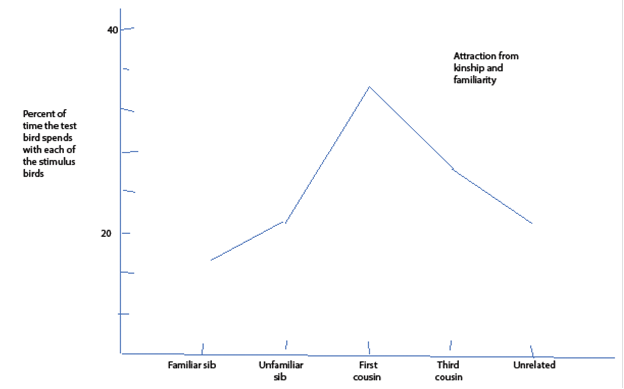
Attraction between close kin familiar and unfamiliar, moderately close kin and “unrelated” (which of course means very distantly related) kin among Japanese quail. Birds were placed where males and females could see each other, but the birds could not see members of their own sex. The vertical axis is the percentage of the time birds spent near members of the opposite sex. The horizontal axis is the degree of familiarity or kinship.
Fig.44 24
Tragically, we have lost Bateson, but it was mentioned in his eulogy that he well understood the relationship between the preference of quail for relatives and the fertility boost this preference gave.
The preference for unfamiliar siblings over sibling nestmates is called, in humans, the Westermark effect. It seems to be a defense against inbreeding, which we already know incurs a fertility penalty.
The quail follow the Sibly curve through some system of recognition even though they cannot know whether a newly met bird is a first or third cousin.
If these birds are not falling in love with relatives, they certainly are giving the appearance of doing so.
So now we have two mating strategies. The mouse strategy is to compete for the high-status place to live and fight over the females leading to a stable population or a single cycle event or strengthening oscillation, and the quail strategy is to be attracted to each other on the basis of kinship or some surrogate of kinship. We shall now peregrinate among three species about which we have some evidence and see what we can find.
Fertility can fall essentially to zero. This phenomenon had been suggested by history, archeology and plagues of wild mice and seen in laboratory mice. Prudence demands we look for the same thing elsewhere.
There have been studies of leaf cutting insects in Canada. The economic importance of such insects is obvious. What researchers have done has been to look at the trees in a plantation, count the number of “leaders,” which means the shoots growing off the main stem of a tree, in infested trees that had insect eggs, the number of leaders that had been killed by the infestation and the average length of the leaders. I should be happy to show you actual data, but what I have is a computer model they developed that gave a sort of idealized pattern. I include only average leader length and number of leaders with eggs in figure 45.
 Detailed studies of the natural history of Pissodes strobi, and of the recovery and defect formation in its coastal host, Sitka spruce was used to develop a computer model, Spruce Results of the Spruce Weevil Attack (SWAT) simulation model showing the dynamics of weevil population, represented by the number of eggs laid on leaders and resulting damage (number of killed leaders) through the life of a Sitka spruce forest from plantation to harvest. In this model, weevil population is regulated by the availability of long leaders (a proxy for food supply), which are more prevalent during the juvenile stage of the stand.
The horizontal axis is the age of the plantation being studied. The vertical axis is the average measurements of leader length and leaders with eggs.
Fig. 45 25
As they report, the number of insects during the first fifteen years or so is regulated by the food supply, the number of long leaders, offered by the trees. However, after that, although long leaders remain plentiful, the numbers of insects drop. The population is then being regulated by Something Else, which I believe to be infertility that is a consequence of the large number of mating insects.
The population rises swiftly, falls less rapidly – the fast up and slower down pattern seen in my laboratory fruit flies and as we shall see the computer model – seems to be leveling off a bit and then dies out. After about year 50 there are no more eggs nor dead leaders.
In isolation one might well conclude that the infested trees are able to produce some chemical that protects them. However, since the same pattern occurs, in Calhoun’s mice where food is plentiful and wholesome, the behavior of these insects strongly supports the suspicion that this will happen to humans in developed countries, with other countries coming along several years later. At all events, these insects are following the occasional time course for mice, the single cycle, and may have a mating strategy like mice rather than like quail.
Now I shall offer a piece of evidence suggesting a pre-zygotic component to fertility. Widespread in North America is a rodent called the deer mouse. Now males compete. Professor Don Fawcett showed us, when I was at Harvard Medical school, some pictures of different kinds of sperm. Most of us think of sperm as all looking about alike and being rather simple in appearance, which is true enough of human sperm. But that day the good professor showed us the sperm of a Lydian jird. The head of this gamete was extremely complex. I suspect now that this was because these sperm compete with each other.
A jird, think gerbil, is a gentle creature; they make good pets, and I should not be surprised to learn that they don’t fight much in the wild. But the sperm compete with each other, I presume. Maybe that happens in other animals, but it is not the invariable rule.
Sperm also cooperate. In the deer mouse they can stick to each other and form a sort of flying wedge.
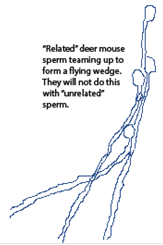
Deer mouse sperm clinging together. Related sperm will do this, but unrelated sperm will not.
Fig. 46 26
Deer mouse sperm cling together. Related sperm will do this, but unrelated sperm will not. Of course, if you go back far enough, all animals are related, this is relative. Evidently the formation swims faster. Sometimes they overdo it and form a ball that looks like it would never get anywhere.
But this is the zinger. The males of closely related sperm are much more likely to form up than of “unrelated” – very distantly related – males. So, sperm, at least in this species, recognize kinship. If they match, they get together. All that is needed, then, is that the egg does the same thing and the mechanism exists for pre-zygotic infertility for gametes not sufficiently related.
So, of our two known mating strategies – status leading to stability, strengthening oscillation or single cycle or attraction, leading to stability or damped oscillation – where does the deer mouse fit? This is kind of tricky, so beware. In mating according to attraction due to kinship, the couple is more likely to get together if they are kin. Here the sperm band of brothers is more likely to form and to succeed in reaching the ovum ahead of others if they are among fellows. Either way, lack of kinship penalizes the chance of a relatively unrelated couple forming and producing offspring.
The next species for which we have interesting data is black footed ferrets
We are not in dire peril from black footed ferrets. Maybe we can learn from them one day.
There was a time when the black footed ferret was extinct in the wild but still survived in captivity. Measures had been taken that would have assured the continuing of these weasels, but there were none left in the wild to protect. So over 4 years, 1991 through 1994 inclusive, captivity bred ferrets were released, a few dozen a year. At first it didn’t seem to be going well. The animals known to be living in the wild did not increase in number so the program was stopped. By 1997 they gave up counting the few stragglers as shown in figure 47.

The vertical bars are the number of black footed ferrets released or counted. Years of release or counting are along the horizontal axis.
Fig. 47 27
Then in 2000 they did another count and found that there were still ferrets out there. It had been six years since the last release, and those had done poorly over the years they were counted. And now the growth of the population was very vigorous indeed.
I wasn’t there, and they did not mention it, but I would assume that care was taken to assure a lot of Genetic Diversity among the released animals because that is a Good Thing. I’m sure you understand my sarcasm and hope you can forgive it.
In the early days after the study I watched a program on the collapsing human birth rate worldwide. I wrote all of the authors and only one responded. He seemed to think there was no such thing as collapsing birth rate even though he had contributed to a book on it. He knew about the black footed ferret experience, so I pointed out that the explosive growth was not seen for some three to six years after the last release; all he could see was “exponential growth.”
At last he gave up on me. Hmm. Exponential growth, eh? Let’s look a little closer. There is a curved line that shows a fair exponential growth curve and has been fitted by computer to give a best match. Were growth truly exponential, the line would fit the tops of the vertical lines perfectly, give or take noise, on my copy of the results. But in fact, at the far left, the bars lie below the exponential growth curve, at or above it in the middle and then back to below at the end as in figure 48.